Have you ever wondered whether something should be called discrete or continuous? This is one of the most common questions in mathematics, statistics, data science, and research. Students, teachers, researchers, and professionals often search for discrete vs continuous because the two concepts look similar but have very different meanings.
Many people ask questions like “What is the difference between discrete and continuous data?”, “How do you know if a variable is discrete or continuous?”, or “What is an example of a discrete and continuous variable?” The confusion usually comes from deciding whether something should be counted or measured.
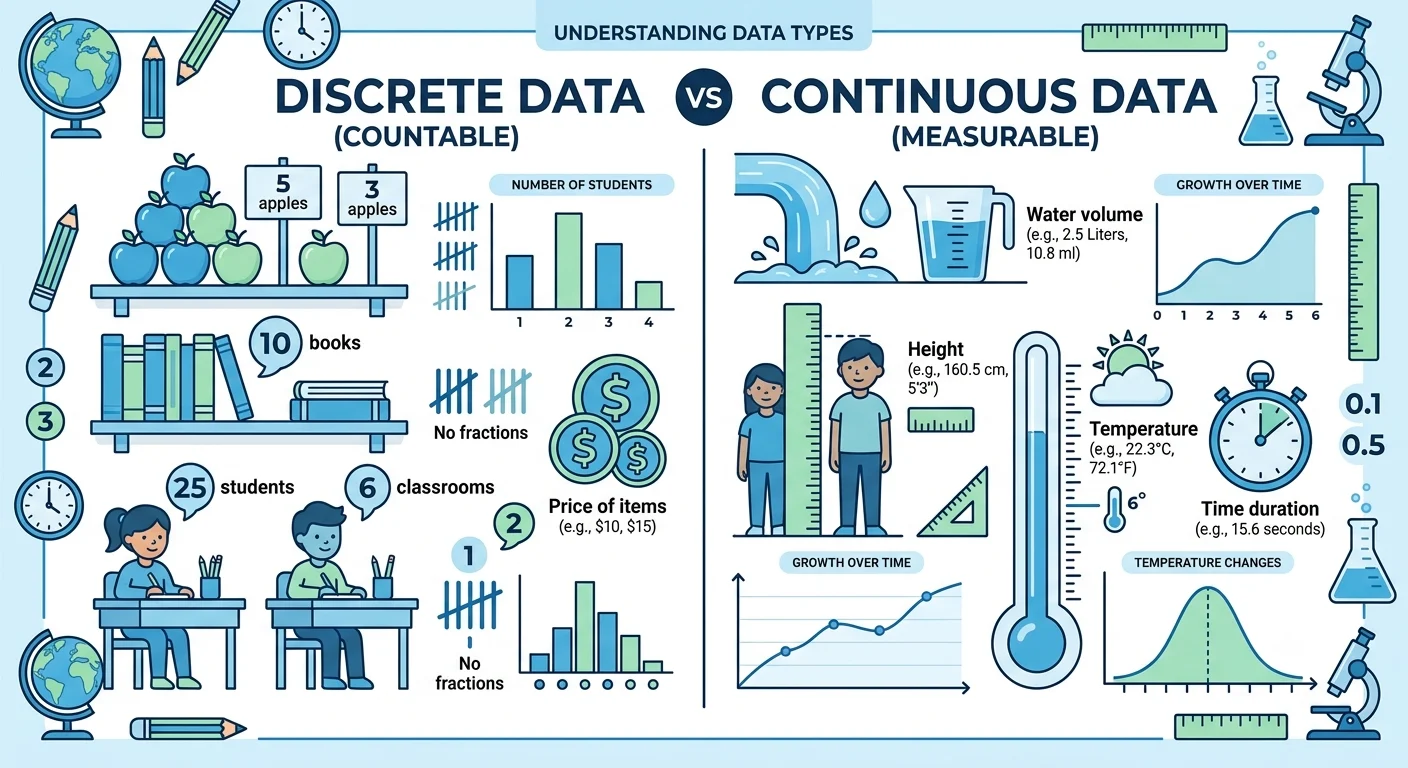
The easiest way to remember the difference is simple: discrete values can be counted, while continuous values can be measured. Understanding this concept helps you choose the correct statistical method, create accurate graphs, analyze research data, and solve mathematical problems more effectively.
In this complete guide, you’ll learn the difference between discrete and continuous data, variables, probability, functions, graphs, and mathematics using simple explanations, real-world examples, comparison tables, and expert tips. Whether you’re preparing for an exam or working with data, this article will help you understand the topic with confidence.
Discrete vs Continuous
The difference between discrete and continuous is based on how values are obtained.
- Discrete means values are counted.
- Continuous means values are measured.
If a value can only exist as separate numbers, it is discrete. If it can take any value within a range, including decimals, it is continuous.
Quick Comparison
| Feature | Discrete | Continuous |
|---|---|---|
| Meaning | Countable values | Measurable values |
| Values | Separate | Infinite |
| Decimals | Usually no | Usually yes |
| Examples | Number of students | Height |
| Graph | Individual points | Connected line |
Simple Examples
| Discrete Examples | Continuous Examples |
|---|---|
| Number of books | Weight |
| Number of cars | Height |
| Number of children | Temperature |
| Number of emails | Time |
| Dice roll | Distance |
How to Know if It Is Discrete or Continuous?
Ask yourself one simple question.
Can I count it?
If yes, it is discrete.
Examples:
- Number of students
- Number of phones
- Number of pets
Can I measure it?
If yes, it is continuous.
Examples:
- Height
- Weight
- Time
- Rainfall
- Speed
What Is the Difference Between Discrete and Continuous Data?
One of the biggest questions students ask is:
What is the difference between discrete and continuous data?
The answer is straightforward.
Discrete Data
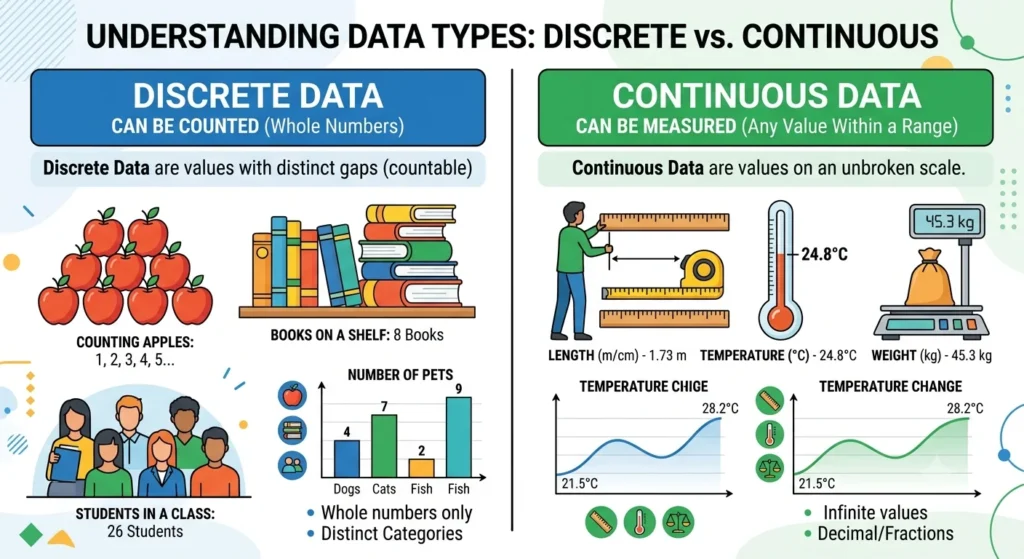
Discrete data consists of values that can be counted individually.
There are no values between whole numbers in most situations.
Examples include:
- Number of students in a classroom
- Number of cars sold
- Number of goals in a football match
- Number of computers in an office
You cannot have:
- 4.6 students
- 2.3 cars
- 7.8 computers
These values must be whole numbers.
Continuous Data
Continuous data consists of values that can be measured.
These values can include fractions and decimals.
Examples include:
- Height
- Weight
- Temperature
- Time
- Speed
- Rainfall
For example:
A person’s height can be:
- 170 cm
- 170.2 cm
- 170.25 cm
- 170.256 cm
There are infinitely many possible values.
Comparison Table
| Discrete Data | Continuous Data |
|---|---|
| Countable | Measurable |
| Separate values | Infinite values |
| Usually whole numbers | Often decimals |
| Based on counting | Based on measurement |
| Used for categories and counts | Used for physical quantities |
Discrete vs Continuous Variable
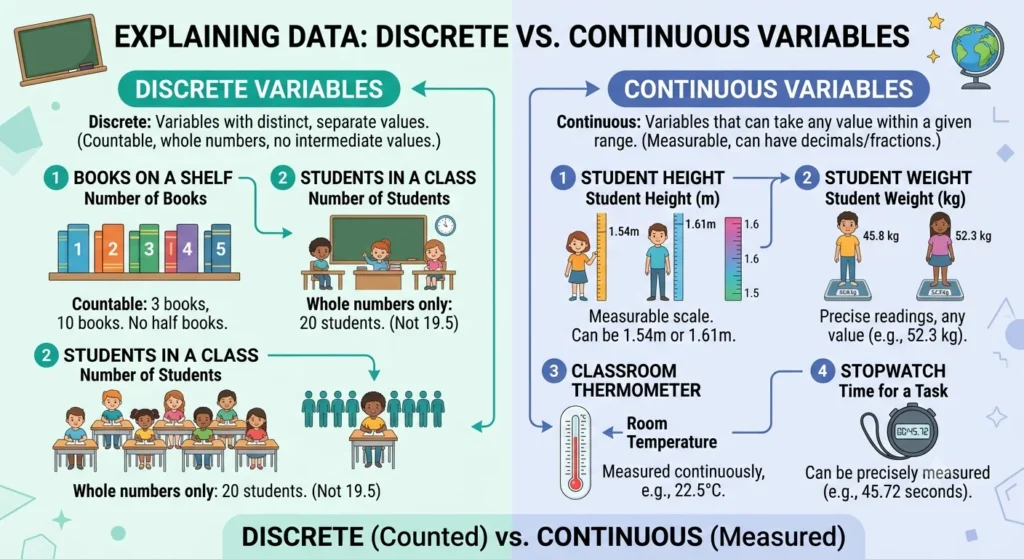
A variable is anything that can change or take different values. In statistics, variables are commonly divided into two main types: discrete variables and continuous variables.
What Is a Discrete Variable?
A discrete variable can only take specific countable values.
Examples include:
- Number of children in a family
- Number of students in a class
- Number of cars in a parking lot
- Number of emails received today
- Number of products sold
Each value is separate and distinct.
What Is a Continuous Variable?
A continuous variable can take any value within a given range.
Examples include:
- Height
- Weight
- Body temperature
- Running time
- Distance traveled
- Blood pressure
These measurements often include decimal values.
Comparison Table
| Discrete Variable | Continuous Variable |
|---|---|
| Number of books | Height |
| Number of pets | Weight |
| Number of customers | Temperature |
| Number of employees | Time |
| Number of houses | Rainfall |
How to Identify Variable Types
Use this simple rule.
| Question | Variable Type |
|---|---|
| Can I count it? | Discrete |
| Can I measure it? | Continuous |
This simple method solves most classification problems.
Why Discrete and Continuous Matter in Statistics and Data Science
Understanding whether data is discrete or continuous is one of the most important skills in statistics, research, and data science.
Before analyzing data, professionals first classify each variable because different types of data require different methods.
For example:
- A statistician chooses different probability distributions for discrete and continuous variables.
- A data analyst selects different charts based on the type of data.
- A machine learning engineer prepares data differently depending on whether variables are countable or measurable.
Choosing the wrong data type can lead to incorrect conclusions.
Why Classification Matters
Correct classification helps with:
- Statistical analysis
- Data collection
- Research methods
- Machine learning
- Predictive analytics
- Business intelligence
- Scientific research
- Healthcare studies
Expert Insight
Professional researchers always identify variable types before beginning statistical modeling. This ensures accurate results and improves the reliability of research findings.
The Origin of the Terms Discrete and Continuous
Although people mainly search for discrete vs continuous to understand mathematics and statistics, knowing where these words come from also makes their meanings easier to remember.
Origin of “Discrete”
The word discrete comes from the Latin word discretus, meaning separate, distinct, or divided.
That perfectly describes discrete values because each value stands alone.
Examples include:
- Three students
- Seven books
- Twelve houses
Each value is separate from the next.
Origin of “Continuous”
The word continuous comes from the Latin word continuus, meaning unbroken or without interruption.
This matches continuous values because they exist on a smooth scale without gaps.
Examples include:
- Height
- Temperature
- Time
- Distance
There are infinitely many values between any two measurements.
Why These Concepts Exist
Mathematicians and statisticians introduced these terms to classify different types of numerical information.
Today, they are essential in:
- Mathematics
- Statistics
- Probability
- Economics
- Engineering
- Data Science
- Artificial Intelligence
- Medical Research
Understanding this distinction helps professionals choose the correct formulas, graphs, and analytical techniques.
British English vs American English
Unlike spelling comparisons such as color vs colour or recognize vs recognise, the words discrete and continuous are spelled the same in both British and American English.
There are no spelling differences.
| Term | American English | British English |
|---|---|---|
| Discrete | ✔ Discrete | ✔ Discrete |
| Continuous | ✔ Continuous | ✔ Continuous |
| Discrete Data | ✔ Discrete Data | ✔ Discrete Data |
| Continuous Data | ✔ Continuous Data | ✔ Continuous Data |
Example Sentences
American English
The survey collected discrete data from 250 participants.
British English
The survey collected discrete data from 250 participants.
American English
Temperature is considered continuous data.
British English
Temperature is considered continuous data.
Because the spelling is identical worldwide, you can confidently use these terms in academic writing, business reports, research papers, and everyday communication.
Which Should You Use? Understanding When Data Is Discrete or Continuous
Choosing the correct type depends on how the information is collected, not on the subject itself.
Ask yourself this simple question:
Am I counting something or measuring something?
If you are counting, the data is discrete.
If you are measuring, the data is continuous.
Use Discrete When You Are Counting
Examples include:
- Number of students in a classroom
- Number of customers visiting a store
- Number of goals scored in a match
- Number of books on a shelf
- Number of website visitors
These values are separate and cannot usually be divided into meaningful fractions.
Use Continuous When You Are Measuring
Examples include:
- Height
- Weight
- Distance
- Temperature
- Time
- Blood pressure
- Rainfall
These measurements can have unlimited decimal values.
Audience-Based Advice
| Audience | Best Practice |
|---|---|
| Students | Learn the counting vs measuring rule first. |
| Teachers | Use real-life classroom examples. |
| Researchers | Classify variables before statistical analysis. |
| Data Analysts | Select charts and probability models based on the variable type. |
| Business Professionals | Identify data correctly before making reports or decisions. |
Discrete vs Continuous Examples
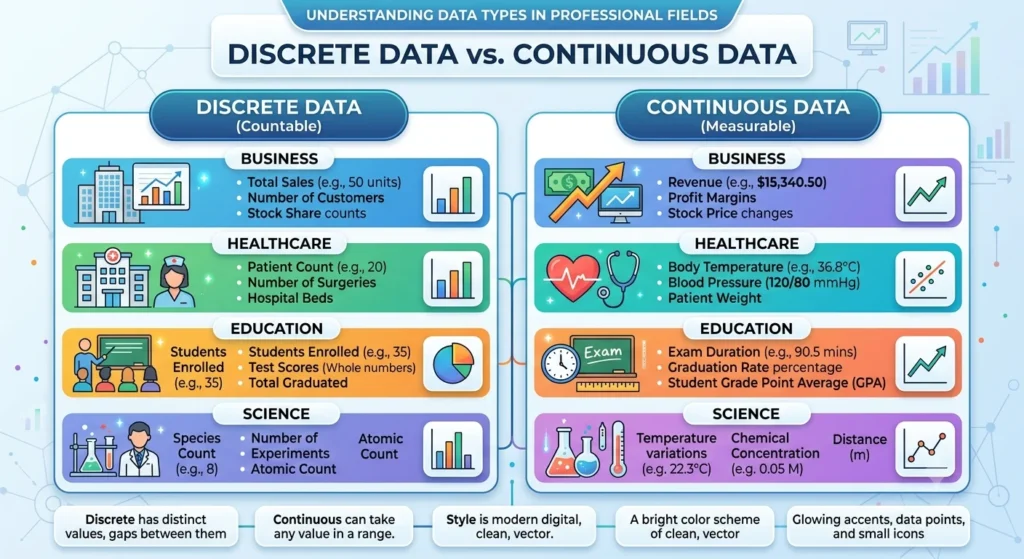
The easiest way to understand these concepts is through everyday examples.
| Situation | Discrete or Continuous? | Why? |
|---|---|---|
| Number of students | Discrete | Students are counted. |
| Height | Continuous | Height is measured. |
| Number of cars | Discrete | Cars are counted. |
| Weight | Continuous | Weight is measured. |
| Number of emails | Discrete | Emails are counted. |
| Time spent studying | Continuous | Time can include fractions. |
| Number of pets | Discrete | Pets are counted. |
| Temperature | Continuous | Temperature changes continuously. |
| Dice roll | Discrete | Only six possible outcomes exist. |
| Distance travelled | Continuous | Distance can have infinitely many values. |
Quick Memory Trick
Count = Discrete
Measure = Continuous
This simple rule correctly identifies most variables.
Real-Life Case Studies
Understanding discrete vs continuous becomes much easier when you see how these concepts are used in everyday situations.
Education
A teacher records:
- Number of students in the class → Discrete
- Students’ heights → Continuous
One value is counted, while the other is measured.
Healthcare
A doctor collects patient information.
- Number of patients treated today → Discrete
- Patient body temperature → Continuous
- Blood pressure → Continuous
- Weight → Continuous
Healthcare professionals rely on correct data classification to improve diagnosis and treatment.
Business
A company prepares its monthly report.
Examples include:
- Number of products sold → Discrete
- Monthly sales revenue → Continuous
- Average delivery time → Continuous
- Number of customer complaints → Discrete
Business analysts use these classifications to improve reporting and forecasting.
Sports
A football coach reviews player performance.
Examples include:
- Goals scored → Discrete
- Running speed → Continuous
- Time played → Continuous
- Number of matches won → Discrete
Scientific Research
Researchers collect different types of quantitative data.
Examples include:
- Number of test samples → Discrete
- Chemical concentration → Continuous
- Experiment duration → Continuous
- Number of successful tests → Discrete
Correct classification improves the quality of statistical analysis and research findings.
Common Mistakes with Discrete vs Continuous
Many learners confuse these two concepts because both involve numbers. However, not every numerical value belongs to the same category.
Here are the most common mistakes.
Mistake 1
❌ Height is discrete.
✅ Height is continuous.
Reason: Height can include unlimited decimal values.
Mistake 2
❌ Number of students is continuous.
✅ Number of students is discrete.
Reason: You cannot have 25.7 students.
Mistake 3
❌ Temperature is discrete.
✅ Temperature is continuous.
Reason: Temperature can take infinitely many values within a range.
Mistake 4
❌ Weight is discrete.
✅ Weight is continuous.
Weight is measured, not counted.
Mistake 5
❌ Every number is continuous.
✅ Some numbers represent discrete values.
Always ask whether the value represents a count or a measurement.
Cello vs Chello: Which One Should You Use?
Discrete vs Continuous Probability
Probability theory also divides random events into discrete probability and continuous probability.
Choosing the correct probability distribution depends on the type of random variable.
Discrete Probability
A discrete probability distribution describes events with countable outcomes.
Examples include:
- Coin tosses
- Dice rolls
- Number of defective products
- Number of customers arriving in one hour
Common probability distributions include:
- Binomial Distribution
- Poisson Distribution
- Geometric Distribution
Continuous Probability
A continuous probability distribution describes measurable values.
Examples include:
- Human height
- Weight
- Time
- Temperature
- Rainfall
Common continuous probability distributions include:
- Normal Distribution
- Exponential Distribution
- Uniform Distribution
Comparison Table
| Discrete Probability | Continuous Probability |
|---|---|
| Countable outcomes | Measurable outcomes |
| Individual values | Infinite values |
| Probability at each value | Probability over an interval |
| Binomial Distribution | Normal Distribution |
| Poisson Distribution | Exponential Distribution |
Discrete vs Continuous Random Variable
A random variable is a value produced by chance.
It can be either discrete or continuous.
Discrete Random Variable
Can take only specific values.
Examples:
- Number shown on a dice
- Number of emails received
- Number of customers entering a shop
Possible values are countable.
Continuous Random Variable
Can take any value within a range.
Examples include:
- Height
- Weight
- Running time
- Daily rainfall
The number of possible values is unlimited.
Discrete vs Continuous Function
Functions in mathematics are also classified as discrete or continuous.
Discrete Function
A discrete function is defined only at particular values.
Examples include:
- Number of customers each day
- Daily sales count
- Weekly attendance
Graphs usually contain separate points.
Continuous Function
A continuous function is defined across an interval without gaps.
Examples include:
- Temperature throughout the day
- Water level in a river
- Speed of a moving vehicle
Graphs appear as smooth connected curves.
Comparison
| Discrete Function | Continuous Function |
|---|---|
| Separate values | Infinite values |
| Individual points | Connected curve |
| Counting processes | Measurement processes |
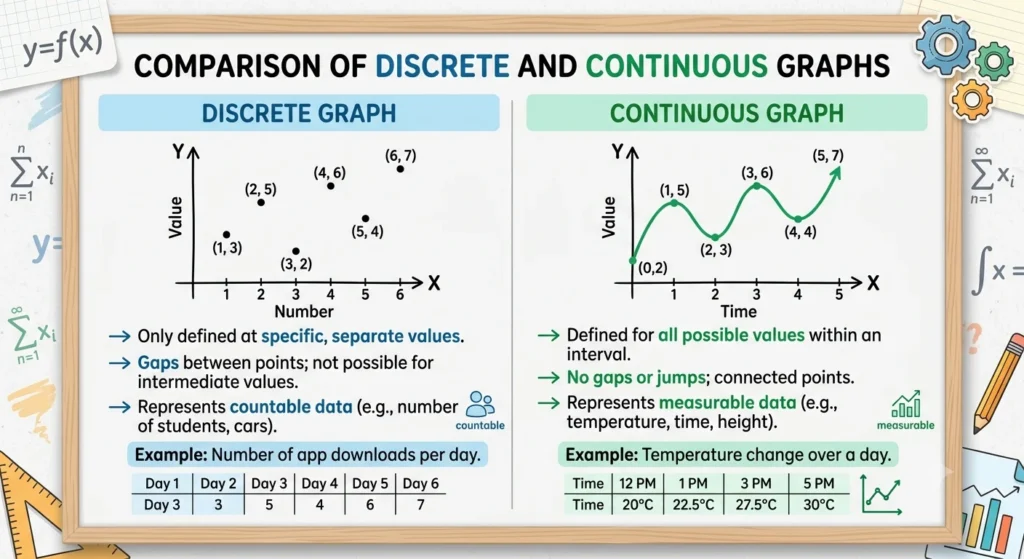
Discrete vs Continuous Graph
Graphs make the difference easy to see.
Discrete Graph
A discrete graph contains separate points.
Examples include:
- Number of books sold each month
- Students attending class each day
No lines connect the points unless used only to show trends.
Continuous Graph
A continuous graph contains connected lines or smooth curves.
Examples include:
- Temperature changes throughout the day
- Heart rate monitoring
- Speed over time
Continuous graphs represent values that change without interruption
Discrete vs Continuous in Mathematics
Both concepts play an important role in mathematics.
Discrete Mathematics
Discrete mathematics studies separate and countable objects.
Major topics include:
- Logic
- Graph theory
- Set theory
- Algorithms
- Combinatorics
- Computer science
Applications include:
- Programming
- Cybersecurity
- Artificial intelligence
- Network design
Continuous Mathematics
Continuous mathematics studies measurable quantities.
Major topics include:
- Calculus
- Geometry
- Differential equations
- Trigonometry
Applications include:
- Physics
- Engineering
- Economics
- Data science
- Machine learning
Both branches are essential and often work together to solve real-world problems.
Discrete vs Continuous Variation
Variation describes how values change within a population, sample, or dataset. In statistics and biology, understanding variation helps researchers identify patterns and make informed decisions.
Discrete Variation
Discrete variation occurs when characteristics fall into separate categories that can be counted.
Examples include:
- Blood type (A, B, AB, O)
- Number of children in a family
- Number of cars in a parking lot
- Eye color categories
These values cannot exist between categories.
Continuous Variation
Continuous variation occurs when characteristics can take any value within a range.
Examples include:
- Height
- Weight
- Skin temperature
- Blood pressure
- Running speed
These measurements can include many decimal values.
Comparison Table
| Discrete Variation | Continuous Variation |
|---|---|
| Separate categories | Measurable range |
| Countable values | Infinite possible values |
| Usually whole numbers | Often decimal values |
| Example: Number of children | Example: Height |
Complete Comparison Table: Discrete vs Continuous
The table below summarizes the key differences at a glance.
| Feature | Discrete | Continuous |
|---|---|---|
| Definition | Countable values | Measurable values |
| Nature | Separate | Uninterrupted |
| Possible Values | Finite or countable | Infinite within a range |
| Decimal Values | Rare | Common |
| Data Type | Quantitative counts | Quantitative measurements |
| Variable Type | Discrete variable | Continuous variable |
| Graph | Individual points | Connected curve |
| Probability | Discrete probability distribution | Continuous probability distribution |
| Mathematics | Discrete mathematics | Continuous mathematics |
| Examples | Students, books, cars | Height, weight, time |
Discrete vs Continuous in Everyday Life
Although these concepts are taught in mathematics and statistics, they are used in many everyday situations.
Emails
Discrete
- Number of emails received today
Continuous
- Time spent reading emails
News Reports
Discrete
- Number of election votes counted
Continuous
- Average temperature during the week
Social Media
Discrete
- Number of followers
- Number of likes
- Number of comments
Continuous
- Time spent watching videos
- Average session duration
Business Reports
Discrete
- Number of products sold
- Number of customer orders
Continuous
- Revenue
- Profit margin
- Delivery time
Healthcare
Discrete
- Number of patients admitted
Continuous
- Body temperature
- Blood pressure
- Heart rate
- Weight
Common Interview Questions About Discrete and Continuous Data
These questions are frequently asked in school exams, college interviews, and data science job interviews.
Is age discrete or continuous?
Age is generally considered continuous because it can be measured precisely in years, months, days, or even seconds.
Is salary discrete or continuous?
Salary is usually treated as continuous because it can include decimal values and be measured over a range.
Is shoe size discrete or continuous?
Shoe size is generally discrete because only specific sizes are available.
Is time discrete or continuous?
Time is continuous because it can be measured with unlimited precision.
Is rainfall discrete or continuous?
Rainfall is continuous because it is measured in units such as millimeters or inches.
Is population discrete or continuous?
Population is discrete because people are counted individually.
Frequently Asked Questions
1. What is the difference between discrete and continuous data?
Discrete data consists of countable values, while continuous data consists of measurable values that can include decimals.
2. What is the difference between continue and discrete data?
The correct comparison is continuous vs discrete data. Continuous data is measured, while discrete data is counted.
3. How do I know if data is discrete or continuous?
Ask yourself whether the value is counted or measured. Counted values are discrete, while measured values are continuous.
4. What is an example of a discrete and continuous variable?
A discrete variable is the number of students in a classroom. A continuous variable is the height of those students.
5. Is height discrete or continuous?
Height is continuous because it can take infinitely many values within a range.
6. Is weight discrete or continuous?
Weight is continuous because it is measured rather than counted.
7. Is temperature discrete or continuous?
Temperature is continuous because it changes smoothly and can include decimal values.
8. Why is identifying variable types important?
Correctly identifying variable types helps researchers, statisticians, and data analysts choose appropriate graphs, statistical tests, and probability distributions.
Conclusion
Understanding discrete vs continuous is an essential skill in mathematics, statistics, probability, research, and data science. While both describe quantitative data, they represent different ways of collecting and analyzing information. Discrete data is based on counting, whereas continuous data is based on measurement. Remembering this simple rule makes it much easier to classify variables correctly.
Whether you are working with discrete vs continuous data, random variables, probability distributions, mathematical functions, graphs, or variation, choosing the correct type leads to more accurate statistical analysis and better decision-making. Students can improve their exam performance, researchers can strengthen their studies, and business professionals can create more reliable reports by understanding these concepts.
If you are ever unsure, ask yourself one question: “Can I count it or do I measure it?” If you count it, the value is discrete. If you measure it, the value is continuous. This simple approach will help you correctly identify most variables and confidently apply these concepts in academics, research, and everyday life.